

Literature-based case study | repeat MBES seabed change detection. Is a red patch on a difference-of-depth map a real seabed change or a survey artifact?
The practical question
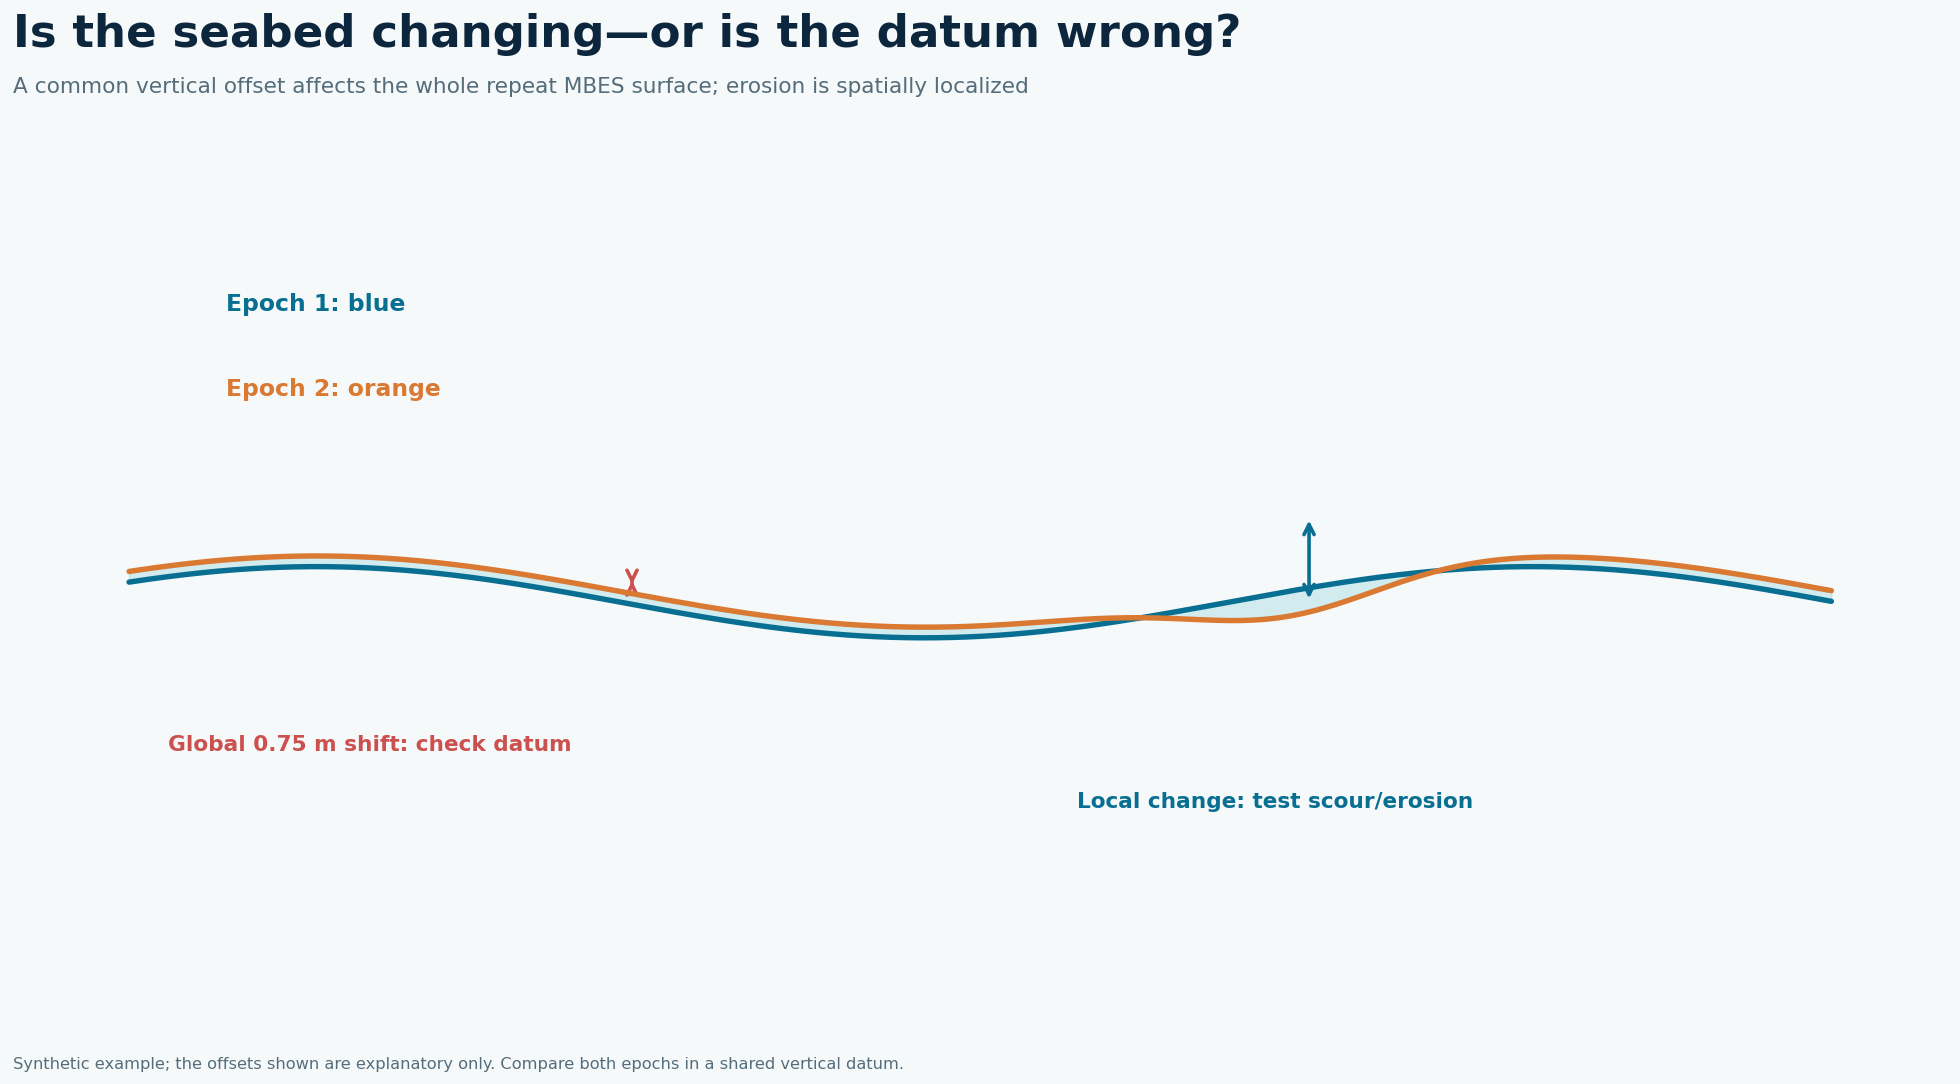
Two beautiful MBES grids can differ because of datum, tide or vertical-reference models, heave, sound speed, positioning, interpolation or coverage. A small apparent change becomes a large volume when integrated over a big area. Conversely, a cable exposure hotspot can be lost when a coarse grid averages the trough and crest.
What the published data actually say
Two multibeam surveys in 1997 and 2008 indicated 14.1 million m³ of sediment loss, averaging −3.1 cm/year across the area. Lease areas occupied 28% of the comparison area but accounted for 9.2 million m³ of loss; 4.9 million m³ was measured elsewhere. Source: Barnard and Kvitek, west-central San Francisco Bay multibeam change study, USGS. These are findings from that location and acquisition setup, not a GeoSubsea project or a universal equipment specification.
A defensible field-to-report solution
Inventory datums, epochs, sensors, processing and survey footprints. Transform both datasets to one horizontal and vertical reference, clip to common coverage and regrid at a resolution supported by both surveys. Compare static surfaces such as bedrock to estimate systematic offset; then quantify each survey’s vertical uncertainty and propagate it into a per-cell level of detection. Mask cells where the observed change is below that threshold. Present erosion and deposition separately, integrate volume only over accepted cells, and record how results change with cell size and threshold.
Worked decision example
The published 9.2 million m³ in the 28% lease area and 4.9 million m³ outside it are regional study results, not a prediction for another wind farm. A project-specific illustrative cell with a +0.15 m difference and a ±0.20 m combined detection threshold should be mapped as unresolved rather than deposition.
What to record in the field
Before subtraction, construct a shared data dictionary: horizontal CRS, vertical datum, tide reduction, survey epoch, uncertainty, cell size and no-data policy. Difference grids should retain the sign convention in the title and legend, for example positive means shallower. At stable surfaces, inspect the distribution of residuals by beam angle and survey line. A coherent offset across known bedrock indicates bias in the measurements or reference transformation, not regional deposition. Correct a supported bias before volume integration and report any remaining residual.
How to make the engineering decision
Calculate a threshold for detectable change from the two survey uncertainties, including systematic and spatially variable components as appropriate. Mask an observed depth change below the threshold and label it unresolved. Test whether the integrated result survives plausible grid and threshold choices; report both gross erosion and deposition before netting them. The San Francisco Bay 14.1-million-m³ loss is a published regional result after comparison of two epochs, not a benchmark for a local cable corridor. The same logic can be applied to a much smaller scour feature with an appropriately finer grid.
QC gates before accepting the interpretation
Review stable-surface residuals, crosslines, outer-beam patterns, sparse edges and datum transformation metadata. Show an uncertainty mask and use a common footprint for every compared volume.
Limits and next action
The study does not justify attributing every change in other locations to dredging or natural transport without local evidence. For a project-specific decision, identify the required engineering tolerance, review the raw survey evidence and agree the validation method before acquisition or reprocessing.
Applied decision scenario
Suppose the newer MBES surface is 0.12 m shallower across a wide flat seabed. If the combined level of detection is 0.18 m, the widespread change is unresolved even though millions of grid cells display the same color. Check whether static rock shows a similar shift and verify the vertical datum. A separate localized 0.45 m scour pit might exceed the threshold and warrant action if both surveys fully cover it. Report regional and local findings separately: a net volume estimate can conceal a narrow asset exposure, while an isolated pit should not be extrapolated to an entire lease area.
Questions to resolve before sign-off
Does a 0.1 m difference automatically mean erosion? No. Check whether the change exceeds a local level of detection after both survey uncertainties and intersurvey bias are considered. Apparent change on static bedrock warns of a reference or processing issue. Plot residuals against depth and beam angle. How should volume be reported? Define the common polygon and sign convention, then give accepted erosion, deposition, unresolved area and net volume. Repeat integration with an alternative justified grid and threshold. When cable risk depends on a small exposure feature, add profiles and verify that line density supports its width. Regional net sediment loss and local asset hazard call for different spatial scales.
Related geophysical services
GeoSubsea supports integrated side-scan sonar, sub-bottom profiler, multibeam and high-resolution 2D seismic processing, survey QC and interpretation. For a defensible site-specific assessment, start with the survey objective, raw data, positioning records and ground truth.
Explore GeoSubsea services · More case studies
Primary reference
Barnard and Kvitek, west-central San Francisco Bay multibeam change study, USGS. The figures above are original editorial illustrations; they do not reproduce source figures.

Leave a Reply