

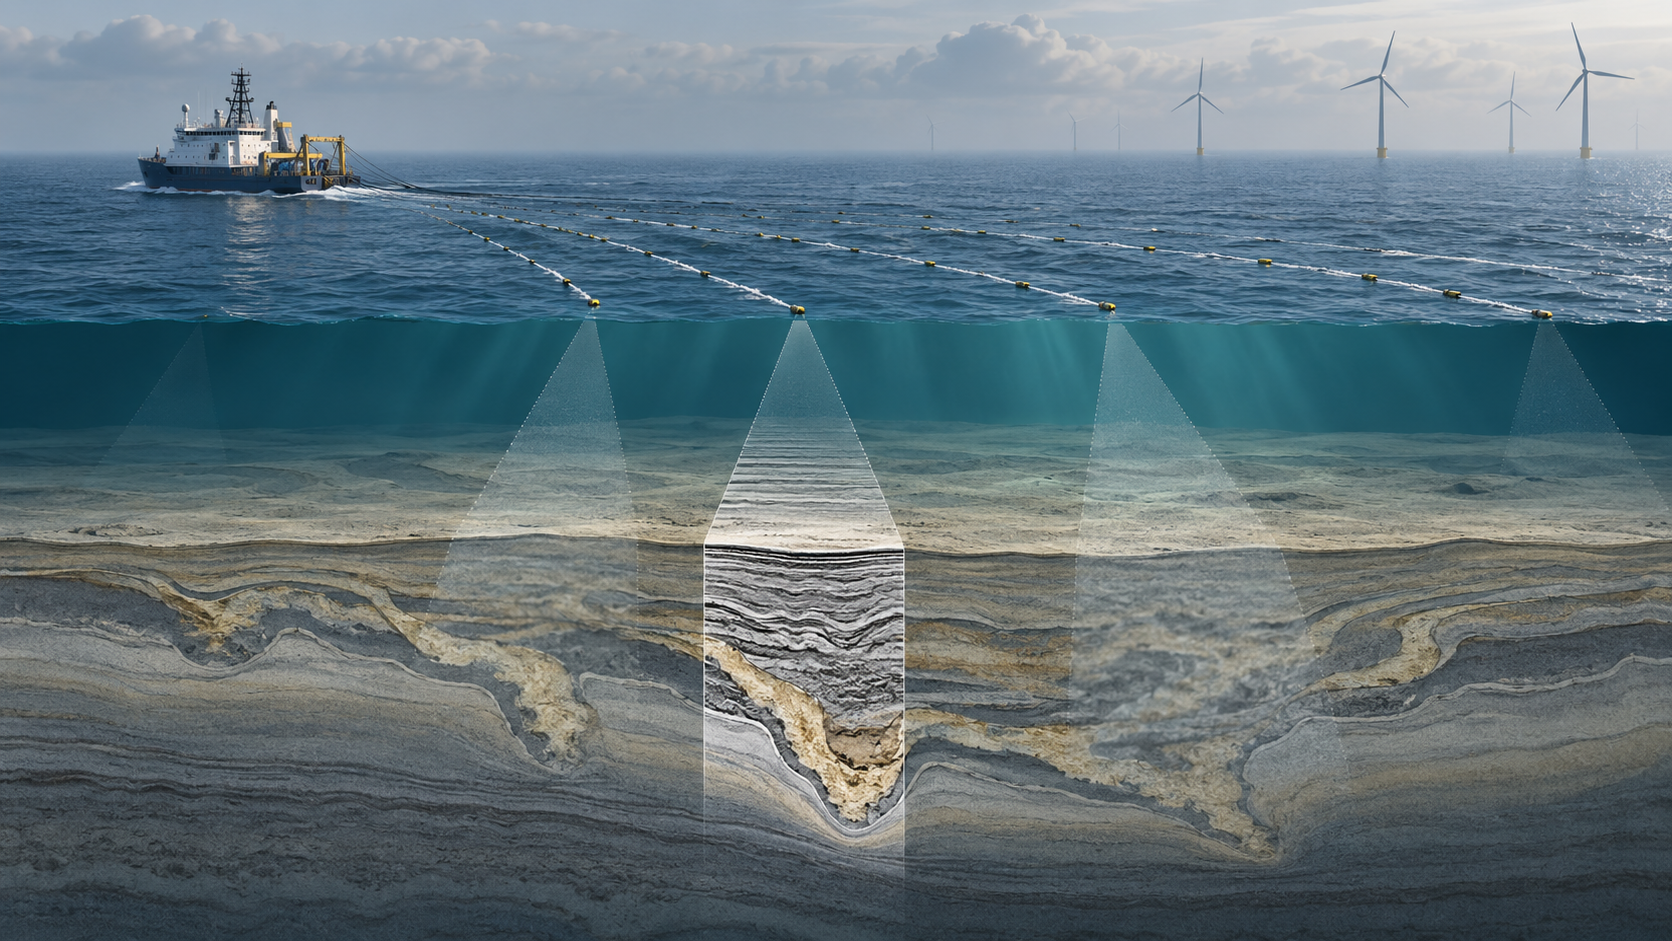
A buried channel drawn confidently on a 2DHR line can move, branch or vanish between lines. For offshore wind, the question is not only where the channel was picked, but how likely it is to cross a proposed foundation location that has never been imaged.
Why a clean section can mislead
On one high-resolution seismic profile, a concave erosional base truncates older reflectors and is filled by contrasting internal events. It looks like a palaeochannel. On a second line 300 m away, there is no obvious cut. A conventional map may connect the two picks into a neat polygon or stop the channel halfway. Either choice looks precise on a GIS display; neither is directly observed in the space between the lines.
The geological issue is especially important for offshore wind foundations. Channel fills can differ from surrounding units in grain size, stiffness and lateral continuity. Their boundaries may concentrate changes in geotechnical properties. Recent research on probabilistic offshore wind ground modelling explicitly compares multiple-point statistics and sequential indicator simulation for predicting palaeochannels away from seismic lines. In that study, 150 m line spacing produced higher accuracy than 300 m and 600 m spacing. These are results for that study’s model and dataset, not a universal spacing specification.
Start with a defensible channel interpretation
Before modelling probability, establish that the picked feature is geological. Examine the raw and processed sections and the expected direction of the channel system. Look for erosional truncation, basal relief, fill architecture, lateral terminations and consistent stratigraphic position. Compare intersecting lines at their actual crossing coordinates and correct timing or navigation differences. A migration smile, multiple or processing footprint should not become a channel simply because it has a curved shape.
Record at least three interpretation attributes for each segment: the observed base and top in two-way time, confidence in the feature’s identity, and confidence in its exact lateral edge. These are different. A clear erosional base may establish a channel but leave its margin uncertain where the line crosses obliquely. Tie a nearby CPT or borehole at the appropriate datum; a seismic facies is not automatically a single soil unit.
From picks to a probability map
At the survey lines, retain the interpreted channel presence, absence and ambiguous zones as conditional data. “Absence” is useful only where imaging quality was adequate to detect the feature. In poor penetration, label unknown rather than forcing zero probability. Build alternative geometries that respect likely width, orientation, branching and stratigraphic setting. Multiple-point statistics can represent complex shapes via a training image; sequential indicator simulation uses spatial correlation assumptions. Neither method can recover a hidden channel from sparse lines without geological assumptions.
Generate an ensemble of plausible channel maps conditioned to the picks. At each location, calculate the proportion of realizations that contain the feature. Display that probability alongside the observed lines and the chosen most likely interpretation. A 70% cell does not mean the channel is 70% as thick or that foundation failure is 70% likely. It means the model ensemble places the interpreted feature there in 70% of its realizations under the stated inputs.
Test whether the model knows what it claims
Withhold one or more entire lines from construction, predict them, then compare predicted channel intersections with the held-out sections. Repeat for different withheld lines. Pixel-level random splitting would leak neighbouring geological information and give misleadingly optimistic validation. Measure detection, false positives and the calibration of predicted probabilities. Check how results change with the assumed channel orientation, training-image geometry and the width assigned to uncertain edges.
Where a proposed turbine position lies near a modelled margin, specify a targeted infill line oriented to cross the likely channel axis and consider a CPT or borehole at a location selected to separate the competing models. Survey design should aim to reduce decision uncertainty, not merely fill the most visually empty part of the map.
Worked planning example
Suppose two parallel 2DHR lines 300 m apart bracket a proposed foundation. One contains a 70 m-wide interpreted channel; the other contains a weak, ambiguous incision. An ensemble conditioned to both sections puts the channel beneath the foundation in 55% of realizations. A perpendicular infill line 60 m from the location reveals a continuous erosional base that crosses the projected foundation area. The new line substantially narrows the map distribution. The numbers are hypothetical; the example illustrates why an infill line should be chosen for information value rather than to confirm the initial polygon.
The follow-up CPT still matters. The channel can contain dense sand, soft mud, heterogeneous gravel or multiple units. Its geometry is only one part of the foundation ground model. The interpreted seismic boundary, a calibrated lithological boundary and the engineering design boundary may each lie at different locations.
How to report the uncertainty
Deliver three layers: observed channel evidence on seismic lines, probabilistic extent between lines, and the intrusive-data interpretation. Provide survey spacing, seismic resolution and penetration limits, validation procedure, geological assumptions and alternative models. At foundation locations, give a short decision statement: what is observed, what is inferred, what property matters, and which additional data could change the decision.
A transparent uncertainty map does not weaken the interpretation. It stops a line-based geological hypothesis from silently turning into a precise foundation fact.
References
“Assessing paleo channel probability for offshore wind farm ground modeling: comparison of multiple-point statistics and sequential indicator simulation” (2025), original research; GEUS shallow marine UHR seismic survey and processing abstract (2024). The decision example is illustrative and is not a GeoSubsea project.
Leave a Reply