

Literature-based case study | MBES backscatter sediment classification. Can a color-coded MBES backscatter map alone specify the sediment a cable or foundation will encounter?
The practical question
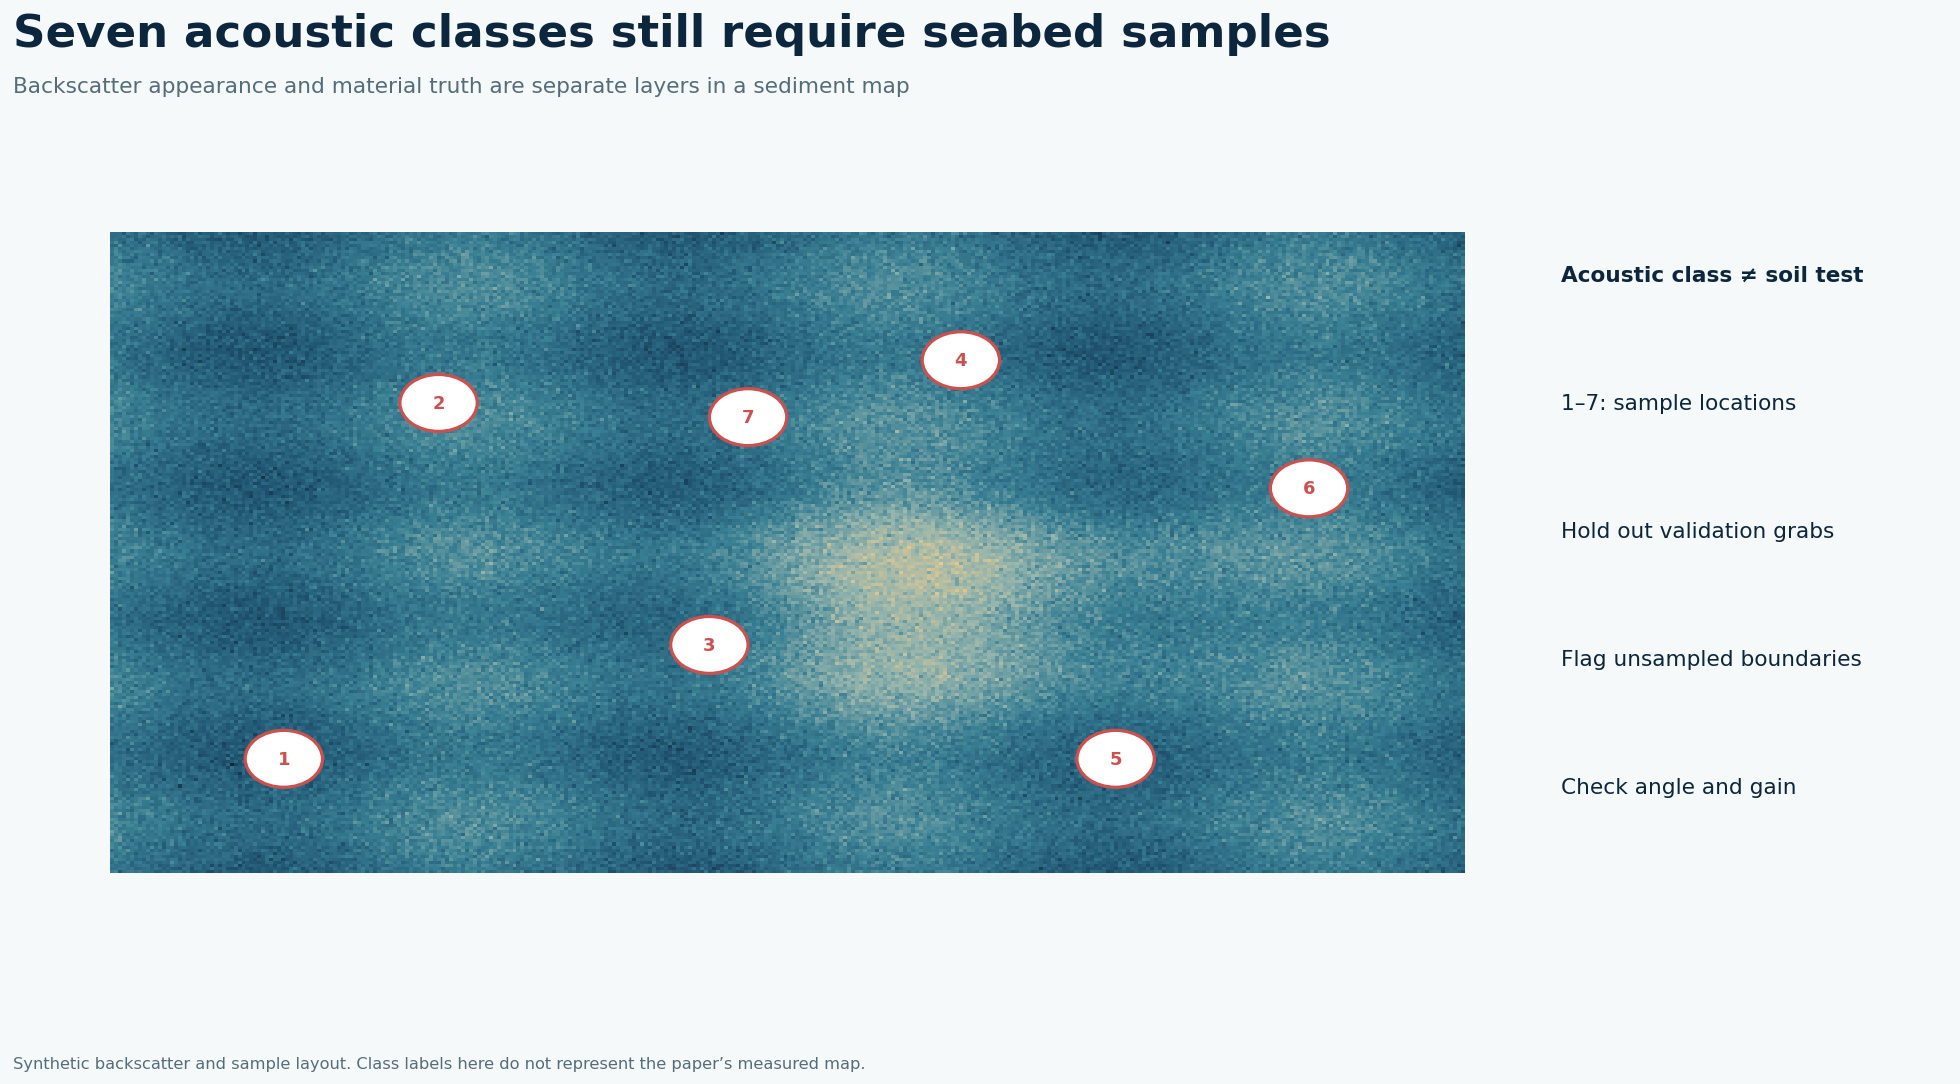
Backscatter depends on more than grain size: incidence angle, roughness, water-column conditions, acquisition settings and shallow subsurface structure can contribute. An overall score around 80% still leaves misclassification, which may be concentrated in the exact minority class important for burial or habitat decisions. A visually smooth map should not be sold as a soil investigation.
What the published data actually say
A Joseph Bonaparte Gulf study combined multibeam bathymetry, backscatter and sediment samples and reported approximately 80% overall prediction accuracy across seven sediment classes. Source: Joseph Bonaparte Gulf random-forest seabed mapping study, Journal of Marine Science and Engineering 2021. These are findings from that location and acquisition setup, not a GeoSubsea project or a universal equipment specification.
A defensible field-to-report solution
Normalize radiometry and angular response by line and system before building predictors. Make a ground-truth plan spanning acoustic facies and boundaries, with grab or core positions matched to the actual sonar footprint and sampling depth. Reserve spatially independent blocks for validation; random neighboring pixels in train and test will exaggerate apparent generalization. Publish the confusion matrix, per-class precision/recall and probability layers alongside the classified map. Direct extra sampling at uncertain boundaries and classes whose errors have engineering consequences.
Worked decision example
If 100 independently validated points produced 80 correct labels, 20 would still be wrong; this is an illustrative translation of an 80% overall accuracy, not the original study sample count. More importantly, 80 correct could conceal poor recognition of a rare gravel unit. Inspect class-specific errors before deciding where to trench or acquire CPTs.
What to record in the field
Design validation around geological variation, not merely convenient vessel stations. Take samples in common acoustic facies, at their boundaries, and in rarer textures that matter to burial resistance or habitat assessment. Document how a grab surface sample differs from the sediment volume influencing a sonar return. Balance acquisition settings across the site; a classifier can learn survey-line gain changes instead of substrate if preprocessing leaves stripes. Hold out whole geographic blocks so the test points are truly separated from training neighborhoods.
How to make the engineering decision
For every predicted class, report how many reference observations were correctly and incorrectly allocated. The approximately 80% overall score in the Australian seven-class experiment does not reveal the error rate of each class by itself. Ask whether the class that changes the engineering decision is reliable: a model that detects sand well but confuses gravel and shell may be unsuitable for a trenchability map. Convert uncertain probabilities into follow-up grab or CPT stations, then retrain only after keeping a separate final validation set untouched.
QC gates before accepting the interpretation
Check raw intensity stripes, angular balance, positional offsets, sample representativeness, spatial leakage and reproducibility of the feature set. Do not extrapolate a trained model beyond its seabed type or sonar configuration without testing.
Limits and next action
The published approximately 80% accuracy is for seven classes in one Australian study, not a guarantee for another site. For a project-specific decision, identify the required engineering tolerance, review the raw survey evidence and agree the validation method before acquisition or reprocessing.
Applied decision scenario
Suppose a predicted gravel patch crosses a cable corridor but only two grabs sampled that class. Even if the model reports 80% overall accuracy, those two points cannot validate gravel performance across the whole patch. Inspect feature values and imagery at its edges, acquire targeted samples on both sides and at the center, and compare with CPT refusal or geotechnical records if available. If the class remains uncertain, provide an uncertainty polygon and trenchability scenarios. The contract decision is whether burial equipment can handle the resistant material, not whether the acoustic color map has a pleasing boundary.
Questions to resolve before sign-off
Can backscatter distinguish gravel from shell everywhere? It depends on geometry, grain mixtures and local substrate. A classifier may confidently label acoustic texture while a grab reveals mixed material. Inspect raw sample descriptions and plan targeted samples across boundaries that affect cable burial. What should a map legend show? Give classes, probability or confidence, and a mask for extrapolation beyond the calibration domain. Include a confusion matrix for the spatially independent test set. Overall accuracy belongs in the report, but it cannot stand alone as the decision criterion for a rare resistant facies. State the number of validation samples per class so readers can judge whether a high per-class score rests on very few observations.
Related geophysical services
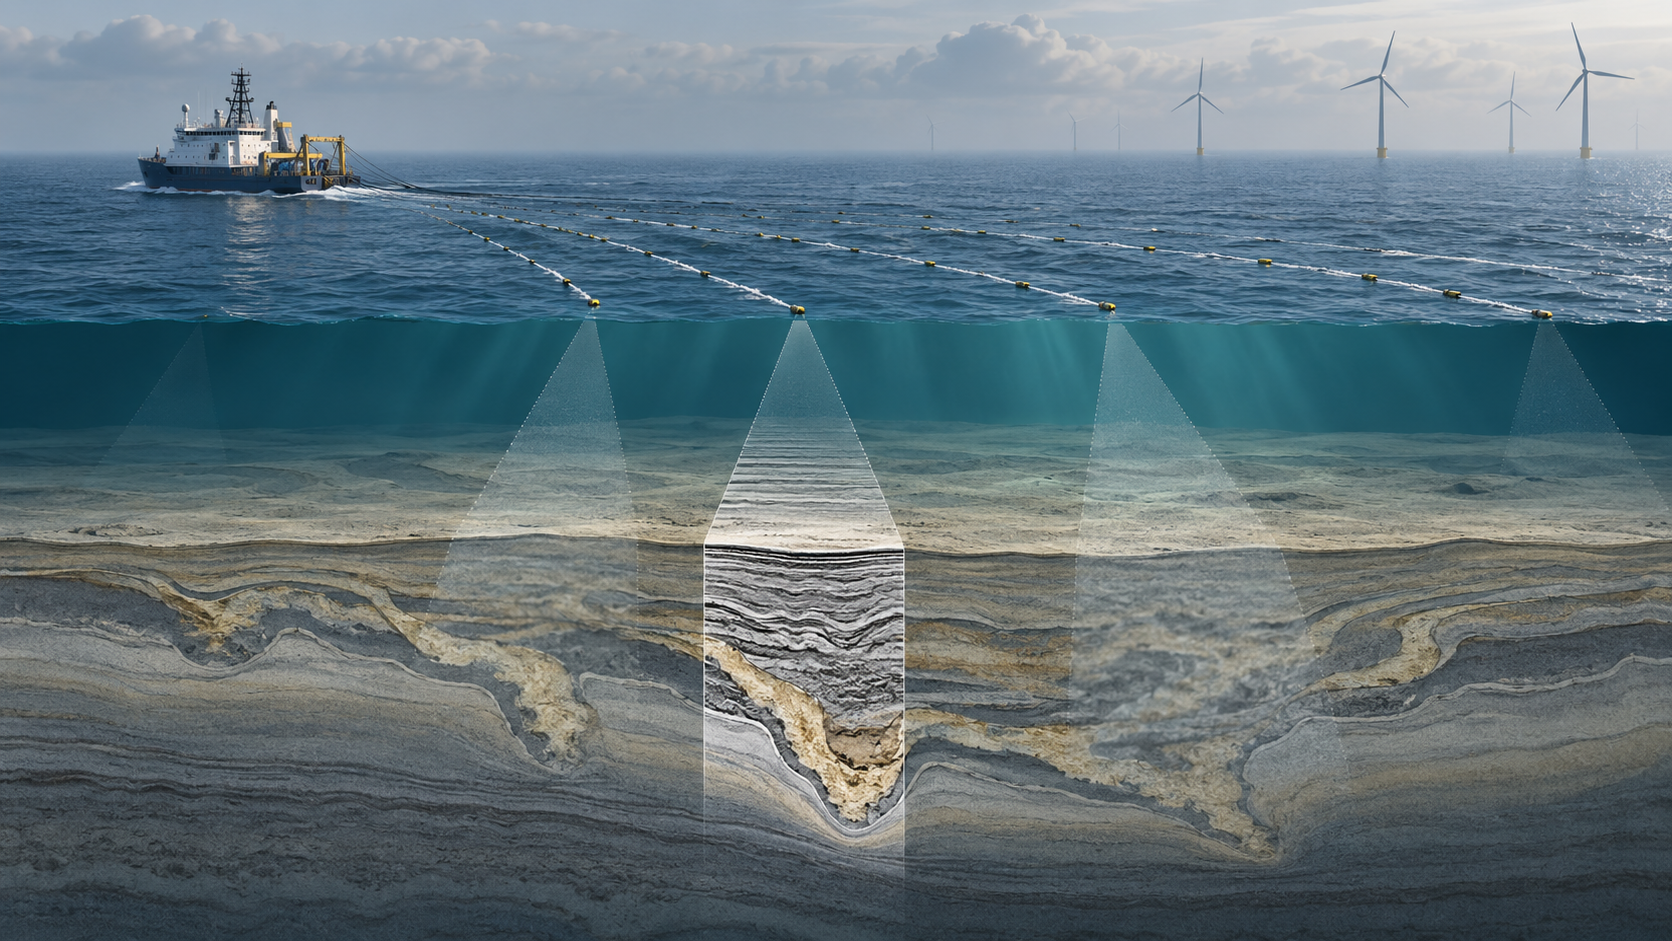
GeoSubsea supports integrated side-scan sonar, sub-bottom profiler, multibeam and high-resolution 2D seismic processing, survey QC and interpretation. For a defensible site-specific assessment, start with the survey objective, raw data, positioning records and ground truth.
Explore GeoSubsea services · More case studies
Primary reference
Joseph Bonaparte Gulf random-forest seabed mapping study, Journal of Marine Science and Engineering 2021. The figures above are original editorial illustrations; they do not reproduce source figures.
Leave a Reply