

Literature-based case study | SBP acoustic blanking shallow gas. When a bright reflector erases deeper SBP returns, is it safe to pick that reflector as competent material?
The practical question
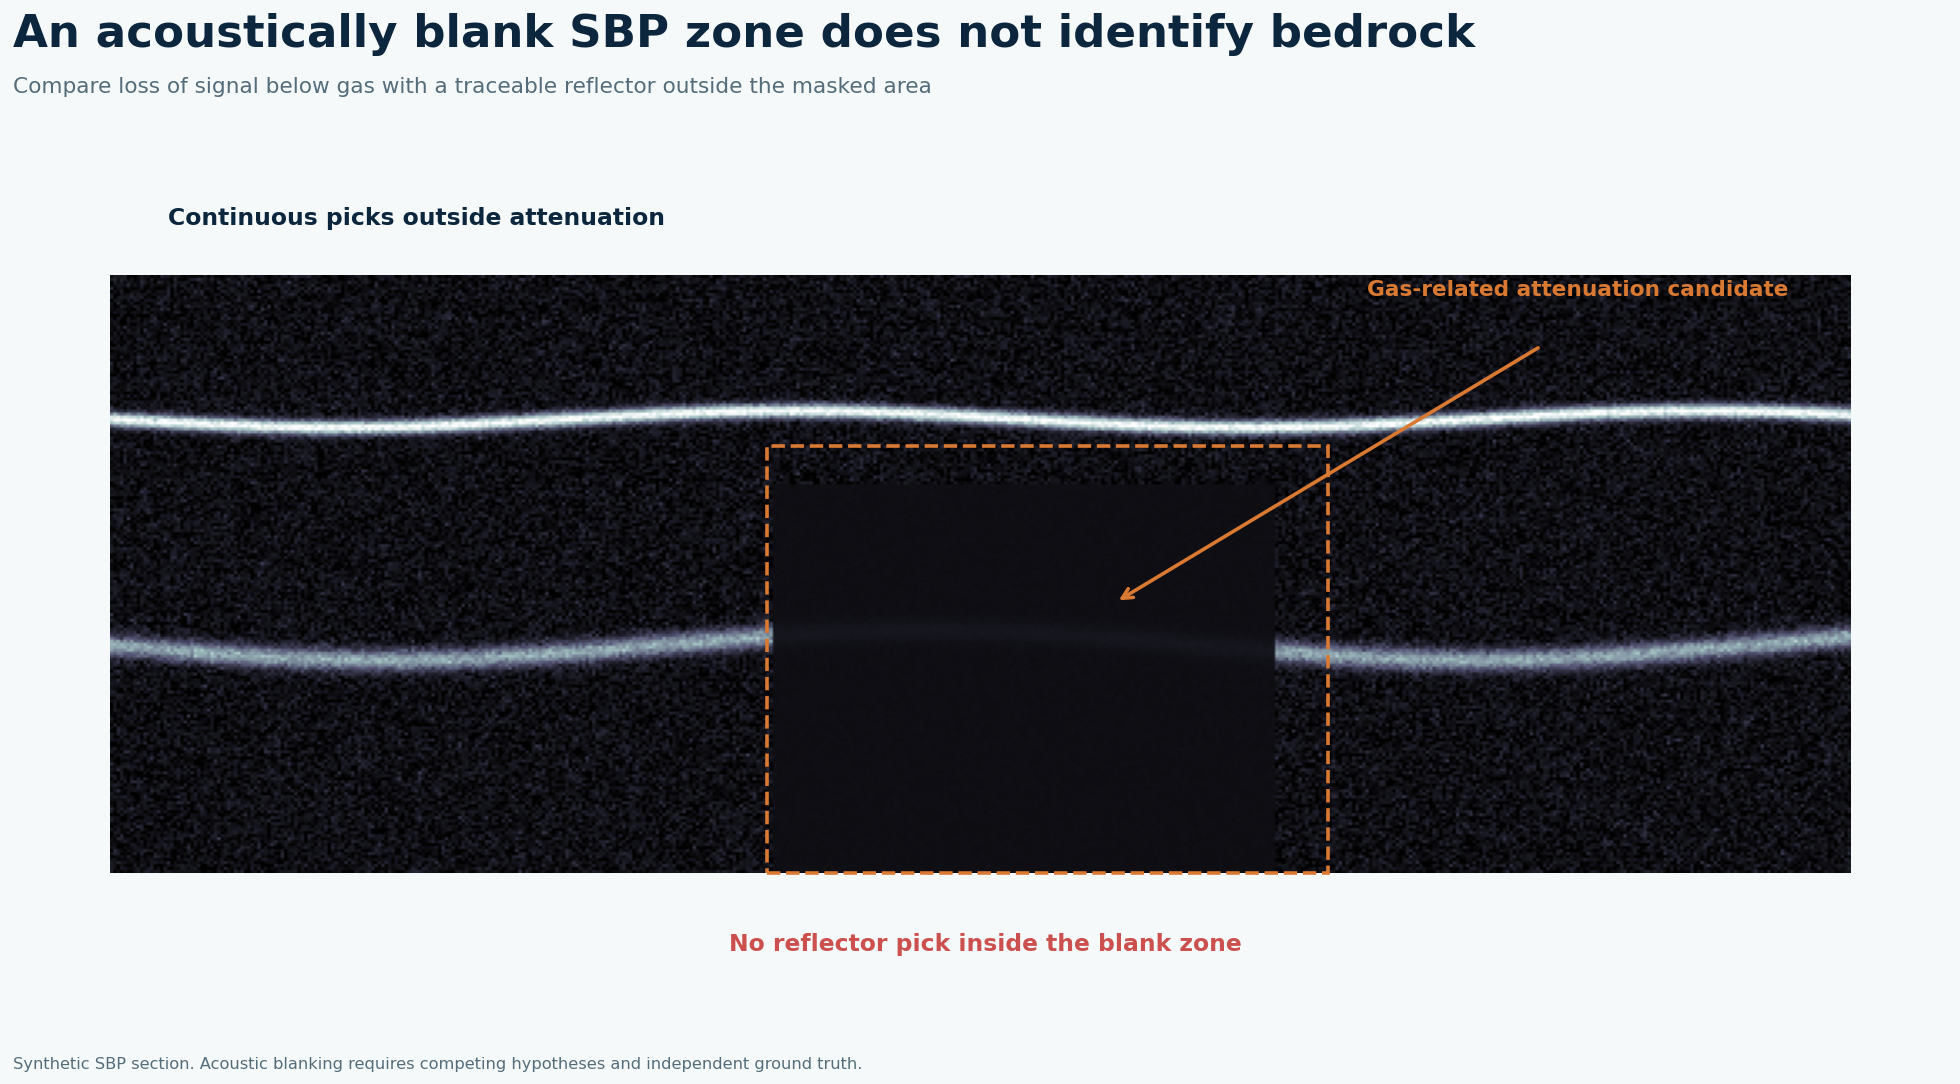
A strong top reflector followed by acoustic wipeout often tempts an interpreter to mark the last visible event as rockhead. Gas bubbles can attenuate and scatter the transmitted pulse, hiding the geology below. In the Korean example, sparker profiles also showed velocity pull-down beneath gas-charged zones. A horizon may therefore look deeper or vanish without any true bedrock step.
What the published data actually say
In the Korea Strait Shelf mud, Chirp acoustic blanking covered about 60% of the study area. The investigators reported in-situ velocity near 800 m/s for gas-charged sediment and an alternative whole-column assumption around 930 m/s; cored gas was almost exclusively methane. Source: Lee and colleagues, Korea Strait Shelf mud, KIOST research record. These are findings from that location and acquisition setup, not a GeoSubsea project or a universal equipment specification.
A defensible field-to-report solution
Map the top of blanking separately from the deepest reliable geological reflector. Inspect raw and processed Chirp/SBP sections at several gains, then compare lower-frequency sparker or 2DHR data that may penetrate further. Mark water-column plumes, seabed pockmarks and amplitude anomalies without treating any one sign as proof. Tie candidate horizons to nearby cores or CPTs. Carry separate scenarios for normal and gas-affected acoustic velocity through depth conversion, and classify every pick as observed, inferred or unresolvable.
Worked decision example
For an illustrative 20 ms two-way time interval, depth is 15 m at 1,500 m/s but only 8 m at 800 m/s, using depth = velocity × time / 2. That 7 m difference is a sensitivity test, not a measurement of layer thickness at the Korean site. It shows why assigning one velocity and a solid rock label to a blank zone can misstate burial or foundation clearance.
What to record in the field
Before drawing a subsurface cross-section, make an interpretation layer for acoustic transparency, turbidity, high-amplitude top reflectors and water-column plumes. These are acoustic observations. Gas is a geological hypothesis supported by several independent signs. Sparker or lower-frequency seismic may image beneath a Chirp wipeout, but a reflector seen there still needs a plausible velocity and a ground-truth tie. If a foundation design uses the first hard reflector, distinguish the top of an attenuating gas zone from proven rock or dense sediment in the legend and deliverable table.
How to make the engineering decision
Set out two depth-conversion envelopes and explain the inputs. The 800 m/s in-situ gas-affected velocity and the alternative 930 m/s whole-column assumption from the Korean study illustrate how model choice changes depth. Neither number should be copied into a new site without local measurements. If an SBP horizon disappears at the edge of blanking, stop the geological line at the last reliable point and draw a dashed inference only where justified by crossing lines or boreholes. In the final report, a no-data interval is a legitimate finding with an explicit recommended investigation.
QC gates before accepting the interpretation
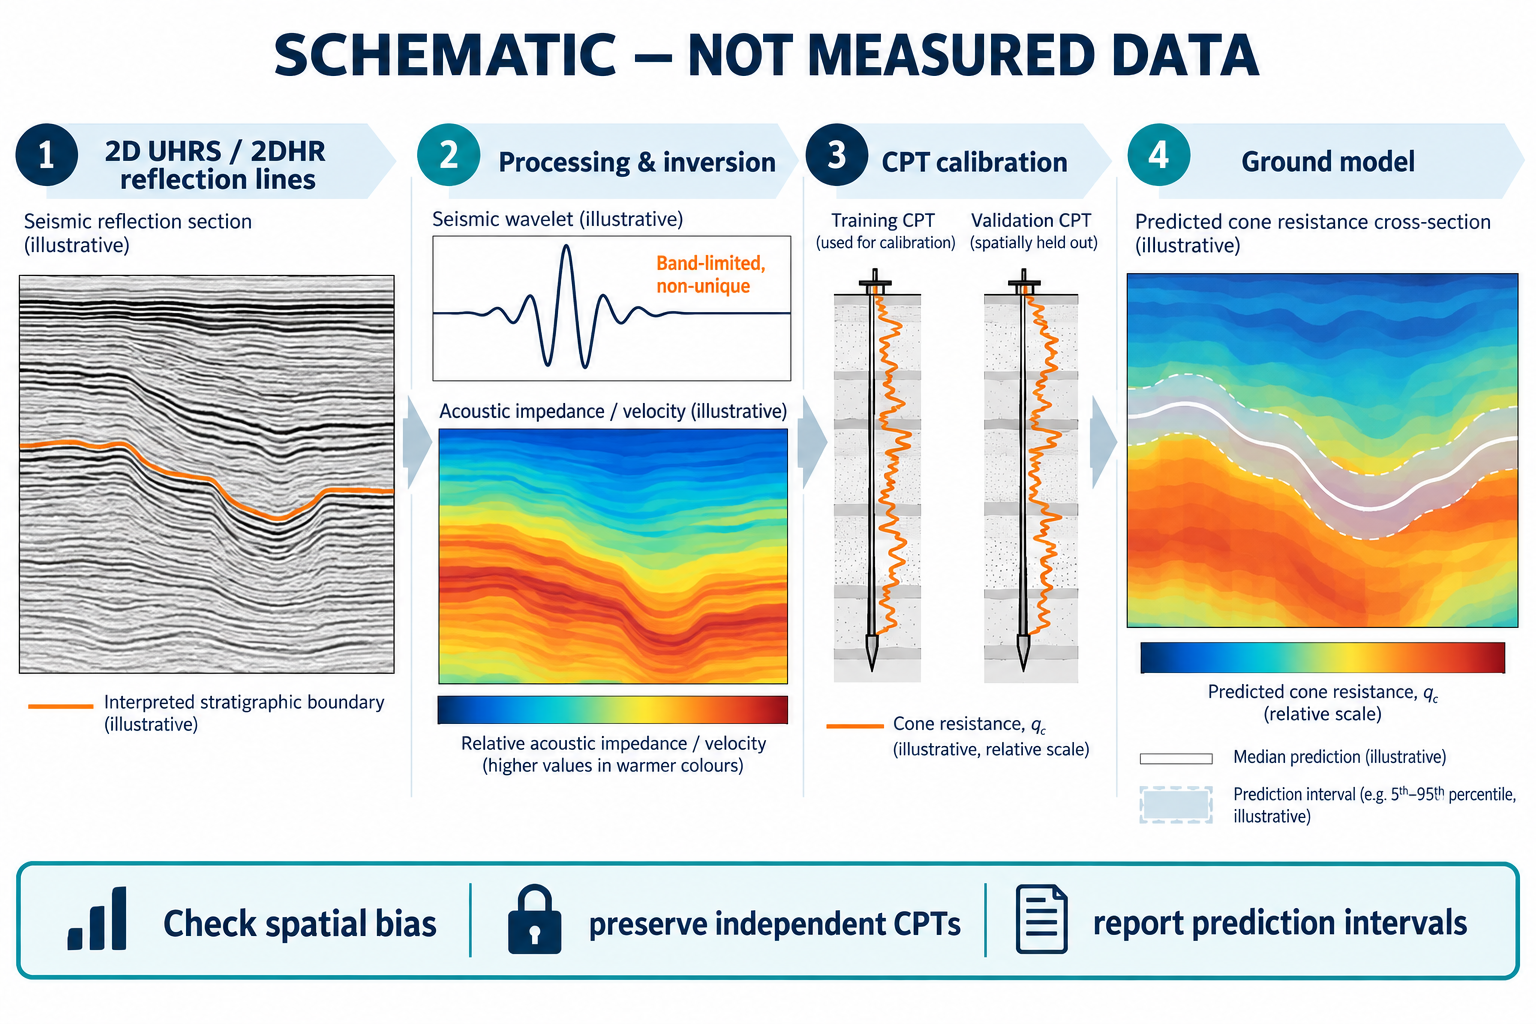
Keep a polygon for blanking and a separate confidence-coded geological horizon. Require an independent borehole or another sensing modality before converting an obscured interval into an engineering boundary. Record the velocity model and explain what data cannot resolve.
Limits and next action
The 60% coverage and velocity estimates describe one study area; gas presence, velocity and penetration must be verified locally. For a project-specific decision, identify the required engineering tolerance, review the raw survey evidence and agree the validation method before acquisition or reprocessing.
Applied decision scenario
Suppose a bright top reflector appears at 12 ms below seabed and every deeper event disappears for several hundred metres. The interpreter can map that top as an acoustic boundary, but cannot establish the material below from that section. Compare the same location in lower-frequency data and on crossing lines, then position intrusive tests where the ambiguous zone affects foundation or cable decisions. If tests confirm gas-charged mud, retain the evidence of the deeper horizon’s uncertainty. If they show a hard layer, update the interpretation and velocity model with the measured tie rather than retroactively treating all blanking as bedrock.
Questions to resolve before sign-off
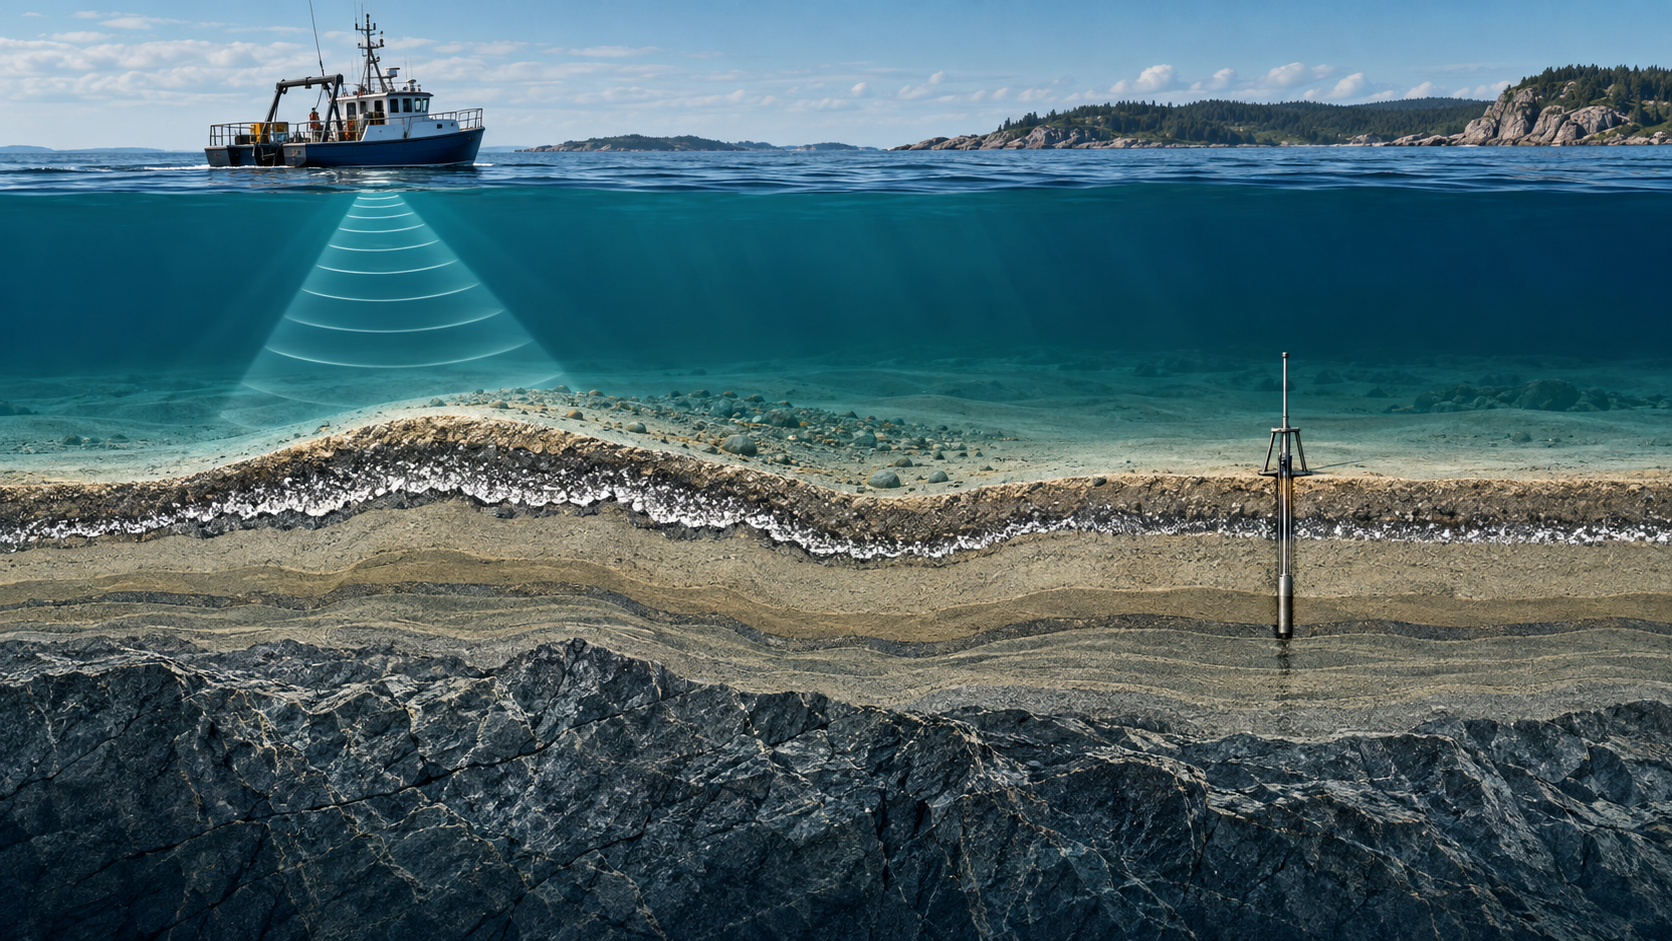
Can a blank zone be interpreted as an absence of sediment? No. Acoustic blanking is an absence of usable reflected information in a particular frequency band. Gas, coarse material, attenuation, geometry or equipment settings may produce different kinds of reduced penetration. Record the observation and possible causes in distinct columns. A hard, continuous seabed reflector and a gas-charged shallow layer imply very different engineering outcomes. What is the fastest useful follow-up? Review overlapping SBP and lower-frequency seismic lines, then locate a small number of boreholes or CPTs across both blanked and unblanked facies. If an installation needs a verified founding layer, test at the decision point instead of extrapolating a reflector from outside the blank zone.
Related geophysical services
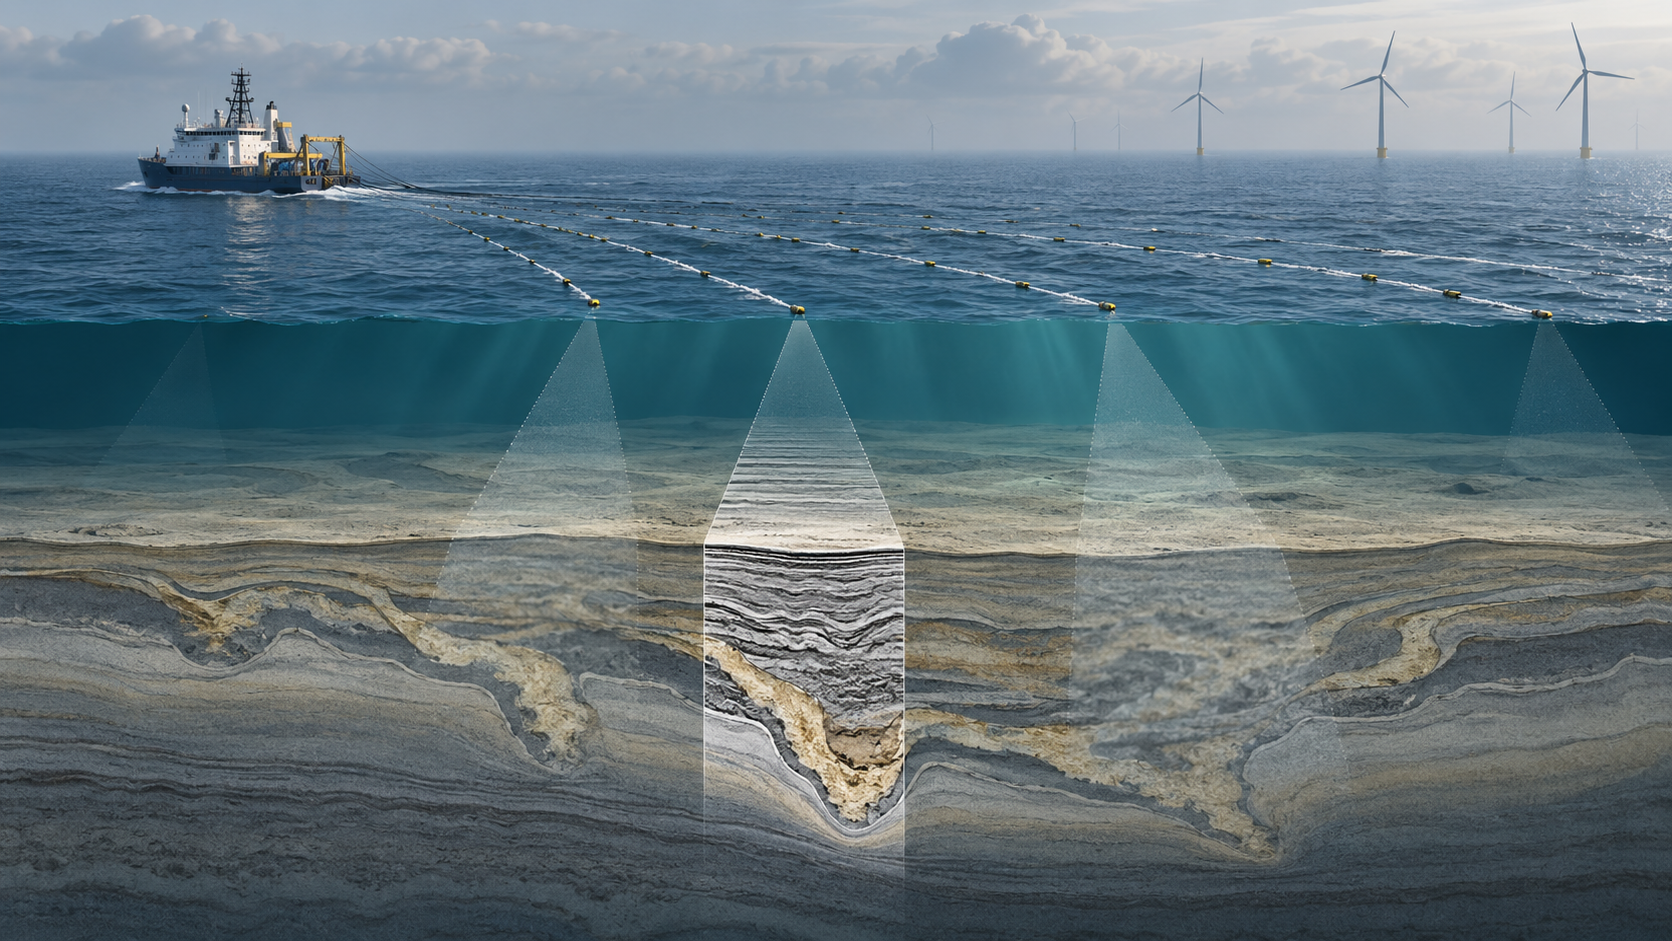
GeoSubsea supports integrated side-scan sonar, sub-bottom profiler, multibeam and high-resolution 2D seismic processing, survey QC and interpretation. For a defensible site-specific assessment, start with the survey objective, raw data, positioning records and ground truth.
Explore GeoSubsea services · More case studies
Primary reference
Lee and colleagues, Korea Strait Shelf mud, KIOST research record. The figures above are original editorial illustrations; they do not reproduce source figures.
Leave a Reply