
Transforming Subsurface Data into Geological Understanding
At GeoSubsea, we provide advanced seismic interpretation and horizon mapping services for both 2D/3D seismic and Ultra High-Resolution Seismic (UHRS) datasets.
Our goal is to transform raw seismic data into accurate geological models, revealing the structure, stratigraphy, and geohazards of the subsurface with clarity and precision.
Seismic interpretation plays a vital role in supporting offshore wind farm foundation design, pipeline and cable routing, geohazard assessments, and oil & gas exploration.
By integrating seismic reflections, geotechnical information, and geological knowledge, we deliver actionable insights that reduce uncertainty and optimize offshore development decisions.
Purpose and Application
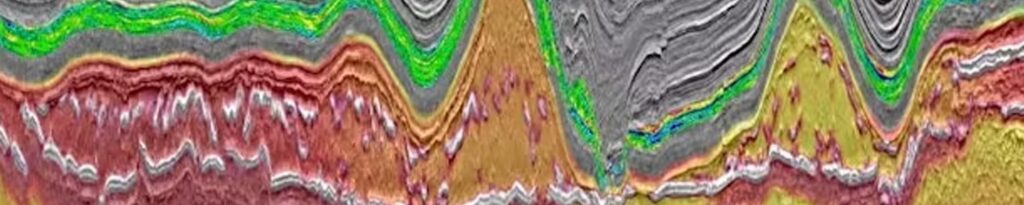
Seismic data interpretation is the process of analyzing reflected acoustic waves to infer the geological and structural framework beneath the seabed.
These reflections represent boundaries between layers of contrasting acoustic impedance, allowing interpreters to map:
- Stratigraphic horizons and sedimentary units
- Structural features such as faults, folds, or unconformities
- Geological hazards including shallow gas, voids, or hard layers
- Thickness and geometry of sedimentary sequences
- Paleo-environmental and depositional patterns
This understanding enables safer, more efficient design and installation of offshore infrastructure — from wind turbine monopiles and jackets to cable burial routes and pipeline corridors.
Our Seismic Interpretation Workflow
At GeoSubsea, we combine advanced interpretation software with geological expertise to ensure accurate and consistent mapping.
Our workflow integrates UHRS, SBP, and conventional seismic datasets into a unified interpretation framework, supported by strict QA/QC controls and peer review.
1. Data Preparation and Quality Review
- Import of processed seismic datasets (SEG-Y, TIFF, or navigation-linked profiles)
- Verification of processing parameters, coordinate systems, and acquisition geometry
- Assessment of data quality — signal-to-noise ratio, reflector continuity, and penetration depth
- Line alignment and trace balancing for visual consistency across the dataset
This step ensures the data is optimized for interpretation and that reflectors can be reliably tracked throughout the survey area.
2. Seismic Visualization and Attribute Enhancement
We enhance the interpretability of seismic data using amplitude and phase attributes to highlight key geological features.
- Application of instantaneous amplitude, frequency, and phase attributes
- Band-pass filtering to enhance specific reflector ranges
- Gain control and dynamic scaling for optimal contrast
- Generation of time-slice and horizon-based attribute maps
These enhancements allow interpreters to distinguish subtle stratigraphic variations, buried channels, and structural discontinuities.
3. Horizon Picking and Stratigraphic Interpretation
Horizon interpretation is the foundation of seismic mapping.
Our experienced interpreters identify and digitize key reflectors that define the boundaries between major lithological or geotechnical units.
- Manual and semi-automated horizon picking using reflection continuity and polarity
- Correlation between crosslines, inlines, and tie lines to ensure consistent mapping
- Definition of stratigraphic units and depositional sequences (Holocene, Pleistocene, etc.)
- Calculation of isopach (layer thickness) maps to quantify sediment volumes and distribution
All interpreted horizons are georeferenced and stored in a 3D environment for accurate spatial analysis.
4. Fault Interpretation and Structural Analysis
Faults and fractures play a critical role in offshore engineering and geohazard risk assessment.
GeoSubsea identifies and characterizes structural discontinuities to understand deformation patterns and potential risks.
- Detection of fault planes, flexures, and lineaments using amplitude discontinuities and curvature attributes
- Mapping of fault orientation, throw, and continuity
- Integration with geomorphological and MBES data for surface correlation
- Identification of potential gas migration pathways or fluid escape features
Our structural analysis supports the identification of stable foundation zones and hazard-prone regions within the project area.
5. Depth Conversion and 3D Geological Modeling
Once the seismic horizons and faults are interpreted, we convert them from two-way travel time (TWT) to depth using available velocity information.
- Compilation of velocity models from UHRS stacking velocities, SBP picks, or borehole data
- Application of time-to-depth conversion using linear or layered velocity functions
- Creation of 3D subsurface models integrating stratigraphy, structure, and geohazards
These models serve as the foundation for geotechnical analysis, soil characterization, and engineering design.
6. Geohazard Identification and Risk Assessment
A key part of our interpretation is identifying potential geohazards that may affect offshore development.
Typical features identified include:
- Shallow gas accumulations and acoustic turbidity zones
- Pockmarks, buried channels, and scour depressions
- Hard layers and boulder fields affecting foundation stability
- Debris fields, shallow faults, or fluid migration zones
Each geohazard is mapped, categorized by severity, and documented for client risk mitigation planning.
Deliverables
At the completion of interpretation, GeoSubsea provides a full suite of deliverables designed for engineering integration and visualization:
- Horizon maps and isopach thickness maps (GeoTIFF, CAD, or GIS formats)
- Fault interpretation maps and structure contour maps
- 2D/3D cross-sections and seismic panels with annotations
- Depth-converted models in SEG-Y, XYZ, or CAD formats
- Geohazard interpretation and risk summary reports
- Final interpretation report detailing methodology, QC results, and geological conclusions
All deliverables are compatible with Kingdom, Petrel, GIS, and AutoCAD platforms and follow IMCA/IHO project documentation standards.
Integration with Other Datasets
To ensure a holistic understanding of the subsurface, our seismic interpretations are integrated with other geophysical and geotechnical datasets:
- MBES bathymetry for surface correlation
- SBP and UHRS for high-resolution shallow stratigraphy
- Magnetometer and SSS for target confirmation and hazard validation
- CPT and borehole data for geotechnical correlation and velocity calibration
This integrated approach delivers a complete geo-engineering model of the project area — from seabed surface to sub-seabed foundation layers.
Why Choose GeoSubsea for Seismic Interpretation
- Proven expertise in UHRS and 2D/3D seismic interpretation for offshore wind and energy projects
- Advanced tools and workflows in Kingdom, RadExPro, Petrel, and Geographix
- Strict adherence to IHO, IMCA, and ISO QA/QC standards
- Interpreters with strong backgrounds in geology, geophysics, and engineering
- Fast, accurate deliverables tailored to project needs and client formats
- Transparent reporting and bilingual communication (English/Korean/Vietnamese)
From Seismic Reflection to Subsurface Reality
At GeoSubsea, we transform seismic reflections into a clear geological vision of the seabed and sub-seabed.
Through meticulous interpretation, horizon mapping, and structural analysis, we deliver the insights you need to build confidently — from cable routes and foundations to full offshore energy installations.
📧 Contact us today at info@geosubsea.com to learn more about our Seismic Interpretation & Horizon Mapping services or to request a sample interpretation report.