
Delivering Clarity and Confidence Through Comprehensive Reports
At GeoSubsea, we believe that precision in data processing must be matched by excellence in reporting.
Our Integrated Geophysical Reports provide clients with a complete, well-structured, and scientifically accurate interpretation of all geophysical datasets — including Multibeam Bathymetry (MBES), Side Scan Sonar (SSS), Sub-Bottom Profiler (SBP), Ultra High-Resolution Seismic (UHRS), and Magnetometer (MAG) data.
Each report is designed to clearly communicate complex subsurface information in a format that is technically rigorous, visually clear, and ready for engineering application.
From offshore wind farm site characterization to cable route and UXO clearance surveys, our integrated reports deliver the clarity and confidence that project engineers, developers, and regulators rely on.
Purpose and Approach
Marine geophysical data processing generates multiple datasets, each providing unique insights into the seabed and sub-seabed environment.
However, true project understanding emerges only when these datasets are combined, correlated, and interpreted together.
Our Integrated Geophysical Reporting process merges all available data sources to create a cohesive geological and geotechnical narrative, ensuring that interpretations are consistent across datasets and aligned with client project goals.
We follow recognized offshore industry guidelines such as:
- IMCA S006 / S015 – Guidance on Offshore Geophysical Surveys
- IHO S-44 – Standards for Hydrographic Surveys
- ISO 9001 – Quality Management Principles
- OGP / OSPAR data handling and metadata protocols
Every GeoSubsea report is compiled and reviewed according to these international standards, ensuring data integrity, traceability, and professional presentation.
Our Integrated Reporting Workflow
The reporting process at GeoSubsea is a multi-stage workflow that ensures every dataset contributes meaningfully to the final interpretation.
We combine technical precision with geological insight to produce engineering-grade deliverables suitable for feasibility studies, design, and regulatory submission.
1. Data Integration and Quality Control
Before interpretation begins, all geophysical datasets are validated, cross-referenced, and standardized in a common coordinate and datum framework.
- Integration of MBES, SSS, SBP, UHRS, and MAG data within a unified GIS environment
- Verification of navigation, datum, and projection consistency
- Cross-correlation between datasets to ensure spatial alignment (e.g., SSS mosaics over MBES grids)
- Metadata compilation for each dataset, including acquisition, processing, and QC parameters
This step establishes a solid foundation for integrated interpretation and ensures every dataset complements the others seamlessly.
2. Survey Methodology and Processing Summary
Each report begins with a detailed description of the survey objectives, methods, and equipment used, providing full transparency on data origin and quality.
- Overview of survey acquisition (vessel, sensors, frequencies, line spacing, and configuration)
- Description of processing software and workflows for each sensor type
- Quality control and error-checking procedures
- Summary of key parameters such as resolution, coverage, and accuracy
This section ensures the client and reviewers can confidently assess data reliability and compliance with contractual specifications.
3. Seabed and Sub-Seabed Interpretation
Using all processed datasets, we perform a comprehensive interpretation of the seabed and underlying stratigraphy.
Seabed Interpretation includes:
- Mapping of morphological features (ridges, depressions, channels, scour marks, bedforms)
- Seabed classification and sediment texture analysis (from SSS and MBES backscatter)
- Identification of anthropogenic objects (debris, anchors, wrecks, pipelines)
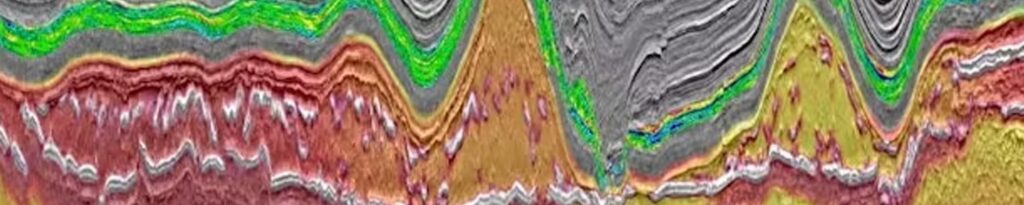
Sub-Seabed Interpretation includes:
- Correlation of SBP/UHRS seismic reflectors to define stratigraphic units
- Horizon mapping and isopach calculations for layer thickness
- Identification of sub-surface structures (faults, buried channels, gas pockets, or hard layers)
Together, these analyses provide a clear view of the surface and subsurface conditions, supporting engineering design and risk assessment.
4. Geohazard Identification and Risk Assessment
A critical part of our integrated reporting is the identification of geohazards that could affect offshore construction or operation.
GeoSubsea systematically reviews all datasets to identify and evaluate potential hazards such as:
- Shallow gas accumulations and acoustic turbidity zones
- Boulder fields, rock outcrops, and hard layers affecting piling or trenching
- Pockmarks, scour pits, and erosional channels
- Buried debris, UXO, or man-made obstructions
- Fault zones or slope instabilities
Each identified feature is analyzed, mapped, and classified according to its potential impact on design or construction.
The Geohazard Risk Assessment section provides recommendations for mitigation or further investigation (e.g., targeted CPTs, boreholes, or dredging).
5. Visualization and Map Production
Visualization is at the core of how we communicate data.
Our cartographers and GIS specialists produce high-quality maps, charts, and figures that illustrate results with precision and aesthetic clarity.
Typical figures include:
- Bathymetric grids, contours, and shaded relief maps
- Sonar mosaics and contact charts
- Stratigraphic cross-sections and seismic profiles
- Magnetic anomaly maps and UXO target locations
- Integrated geohazard and interpretation summary maps
Each figure is standardized with consistent symbology, coordinate reference, and scale — ensuring easy comparison and alignment with other project deliverables.
6. Reporting, Review, and Delivery
After interpretation and visualization, GeoSubsea’s reports undergo a multi-level review process to guarantee accuracy, consistency, and clarity.
- Internal technical review by senior geophysicists and QA specialists
- Cross-check of all figures, tables, and coordinates
- Validation of interpretations with raw and processed data
- Final formatting and layout for publication in professional templates
Reports are delivered in multiple formats to accommodate different client needs and software environments.
Deliverables
At the end of every project, GeoSubsea provides a comprehensive reporting and data package that includes:
- Final Geophysical Interpretation Report (PDF and editable Word versions)
- GIS shapefiles, geodatabases, and metadata files for spatial visualization
- Bathymetric grids, seismic horizons, and contour data in XYZ, GeoTIFF, or CAD formats
- All figures, charts, and cross-sections in high-resolution PDF and image formats
- QA/QC documentation summarizing processing parameters and data lineage
All deliverables are engineering-ready, enabling direct integration into design workflows, GIS models, or project documentation for regulatory submission.
Why Choose GeoSubsea for Integrated Reporting
- Comprehensive multi-sensor integration — MBES, SSS, SBP, UHRS, and MAG datasets combined into a single coherent narrative
- Standardized structure and formatting aligned with IMCA, IHO, and ISO guidelines
- In-depth interpretation with clear engineering relevance
- Professionally designed visuals and maps created for clarity and client presentations
- Rapid delivery and version control for multi-phase projects
- Bilingual documentation available in English, Korean, and Vietnamese for international coordination
From Data to Decision — Complete Clarity in Every Layer
At GeoSubsea, we turn complex marine geophysical data into clear, concise, and decision-ready reports.
Our integrated reporting brings together the full spectrum of geophysical evidence — from seabed texture to sub-seabed structure — providing the foundation for safe, informed offshore development.
📧 Contact us today at info@geosubsea.com to request a sample report or discuss your next project’s integrated geophysical reporting needs.